Thermo Fisher Scientific › Electron Microscopy › Electron Microscopes › 3D Visualization, Analysis and EM Software › Use Case Gallery
Unprecedented combination of resolution, field of view and contrast for the analysis human enamel carious lesions was achieved. Synchrotron X-ray micro-computed tomography revealed sub-micron details of enamel rod and inter-rod regions inaccessible by laboratory tomography. Successful segmentation and labelling allowed the extraction of enamel etching patterns and statistics. Correlation was obtained between synchrotron X-ray micro-tomography and FIB-SEM cross-section analysis.
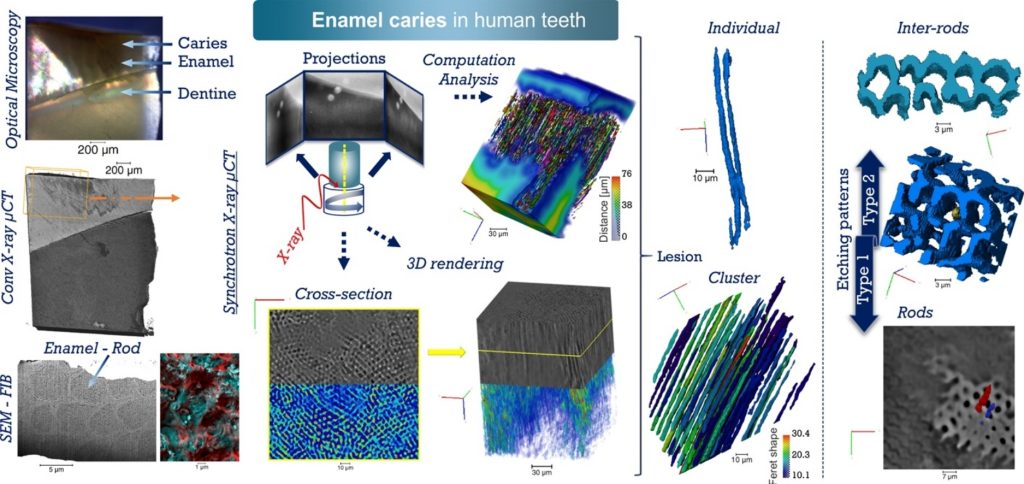
We report major advances in the analysis of synchrotron 3D datasets acquired from human healthy and carious dental enamel. Synchrotron tomographic data for three human carious samples and a non-carious reference tooth sample were collected with the voxel size of 325 nm for a total volume of 815.4 × 815.4 × 685.4 μm3. The results were compared with conventional X-ray tomography, optical microscopy, and focused ion beam-scanning electron microscopy. Clear contrast was seen within demineralised enamel due to reduced mineral content using synchrotron tomography in comparison with conventional tomography. The features were found to correspond with the rod and inter-rod structures within prismatic enamel. 2D and 3D image segmentation allowed statistical quantification of important structural characteristics (such as the aspect ratio and the cross-sectional area of voids, as well as the demineralised volume fraction as a function of lesion depth). Whilst overall carious enamel predominantly displayed a Type 1 etching pattern (preferential demineralisation of enamel rods), a transition between Type 2 (preferential inter-rod demineralisation) and Type 1 was identified within the same lesion for the first time. This study does not provide extensive results on the different lesions studied, but illustrate a new method and its potential application.
In both samples, an initial platinum (Pt) deposition and marker for drift correction were set. These cross-sections were then imaged using SEi and BSi with 5 keV, similar to other locations of AEC2. The BSi of one location of the carious sample was filtered, segmented and analysed in two-dimensions (2D) to quantify the porosity using Avizo software. Images from microscopy were analysed using Avizo, colour maps were adjusted as necessary to maximise clarity.
EAC2 was also coated with 10 nm Au/Pd after that a few cross-sections were made (Locations 1-5 from SI-1 Fig. S12), and the SEi and BSi were taken with 10 keV. The Euclidian distance between voids was computed from the BSi after applying a median filter, and then performing the segmentation of the region between voids using ‘interactive thresholding‘ (Avizo software v2020-1) for each location analysed. Additional details on the computation are mentioned in the micro-computed tomography analysis
For Research Use Only. Not for use in diagnostic procedures.