4D visualisation of in situ nano-compression of Li-ion cathode materials to mimic early stage calendering
S. R. Daemi,X. Lu, D. Sykes, J. Behnsen, C. Tan, A. Palacios-Padros, J. Cookson, E. Petrucco, P. J. Withers, D. J. L. Brett and P. R. Shearing - Electrochemical Innovation Lab, Department of Chemical Engineering, UCL, London, UK ,Henry Moseley X-ray Imaging Facility, Photon Science Institute, The University of Manchester, Manchester, Johnson Matthey, Technology Centre, Blounts Court Road, Sonning Common, Reading, UK

Lithium-ion (Li-ion) batteries operate via electrochemical reactions between positive and negative electrodes, formed by complex porous microstructures. An improved understanding of these materials can lead to a greater insight into the link between microscopic electrode morphology and macroscopic performance. The practice of calendering electrodes after manufacturing has been widely used to increase the volumetric energy density and improve the electrical contact between electrode material particles and with the foil substrate. In this paper we present, for the first time to the authors’ knowledge, a technique to image battery electrodes in situ and in 3D whilst undergoing uniaxial compression with the intent of emulating the calendering process. This technique allows the tracking of electrode strain during compression and its further application will lead to a thorough understanding of crack initiation and propagation mechanisms within electrode particles, ultimately optimising their design and performance.

How Amira-Avizo Software is used

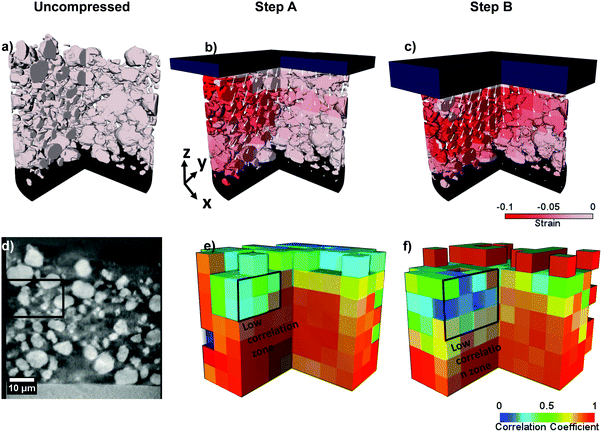
The volumes at different loads were registered by using the particle highlighted by the 8 μm box in Fig. 2c as a reference, and used to run the DVC module in the subset-based mode in Avizo 9.4. DVC algorithms have been widely used in the literature to quantify displacements and microstructural evolution for a diverse range of applications. An edge length of 8 μm as the sub-volume edge length was selected as this provides an adequate compromise between feature detection and second highest average correlation coefficient (CC) of 0.81. Further information on how the sub-volume edge length was chosen and background information on the DVC algorithm can be found in the ESI