Thermo Fisher Scientific › Electron Microscopy › Electron Microscopes › 3D Visualization, Analysis and EM Software › Use Case Gallery
Through collaboration, the KAUST Visualization Core Lab (KVL) team augments the efforts and domain expertise of KAUST researchers by providing complimentary technical knowledge with exploratory visualization and analytic tools. KVL’s multi-year collaboration with KAUST Distinguished Professor P. Magistretti and research scientist C. Calì’s KAUST-EPFL Alliance for Integrative Modelling of Brain Energy Metabolism project—itself a collaboration with the Swiss Blue Brain Project (BBP)—exemplifies the benefits and opportunities of this approach. One of Calì and Magistretti’s contributions to the BBP was the production of 3D models of astrocytes, a type of glial cell found in the brain. Astrocytes help provide nutrients to neurons; support the blood-brain barrier; assist with neurotransmission; help repair nervous tissue after any injuries; and also play a role in neuronal development and plasticity. Using their 3D models, the Magistretti-Calì team worked to discover the mechanism through which lactate, an organic molecule produced by many of the body’s tissues, flows from astrocytes to neurons and not from neurons to astrocytes. For Magistretti and Calì’s project, the KVL team provided systems expertise and access to the large memory and interactive computing resources needed to segment gigabyte-sized image stacks of brain tissue into cellular components.
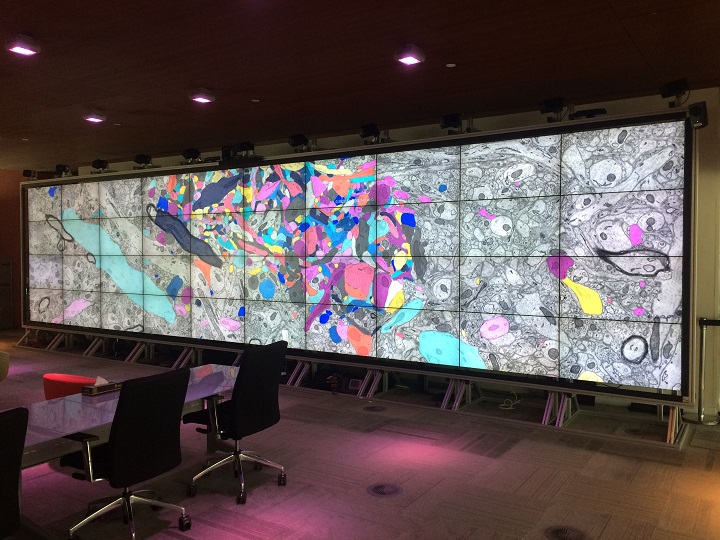
[KAUST Visualization Core Lab showed the Magistretti-Calì team] “how to use Avizo, a data visualization and analysis tool. It helped to assist them with skeletonization of the segmented cells into graphs and also enabled integration of the products with the rest of their tools and workflows. (…) As the number of individuals working with Magistretti and Calì continued to grow, the biologists and segmentation technicians needed to review their work together. KAUST Visualization Core Lab’s large Showcase Display Wall enabled the entire team to see entire swaths of data clearly; work with familiar tools; and communicate directly.”
For Research Use Only. Not for use in diagnostic procedures.