Thermo Fisher Scientific › Electron Microscopy › Electron Microscopes › 3D Visualization, Analysis and EM Software › Use Case Gallery
Ovarian cancer is the leading cause of death among gynecological cancers, but is poorly amenable to preoperative diagnosis. In this study, we investigate the feasibility of “optical biopsy,” using high-optical-resolution photoacoustic microscopy (OR-PAM) to quantify the microvasculature of ovarian and fallopian tube tissue. The technique is demonstrated using excised human ovary and fallopian tube specimens imaged immediately after surgery. This report describes the first application of Amira to ovarian tissue vasculature.
We report the development and application of a novel high optical-resolution photoacoustic microscopy (OR-PAM) system for imaging microvascular components of ovarian tissue and fallopian tube. For the first time, quantitative parameters for characterizing microvascular components of ovarian tissue and fallopian tube are derived using the Amira software. The parameters include three-dimensional vascular segment count, total volume and length, which are associated with tumor angiogenesis. Qualitative results of OR-PAM demonstrate that malignant ovarian tissue has larger and tortuous blood vessels as well as smaller vessels of different sizes, while benign and normal ovarian tissue has smaller vessels of uniform size. Quantitative analysis shows that malignant ovaries have greater tumor vessel volume, length and number of segments, as compared with benign and normal ovaries. Our pilot study suggests that OR-PAM may provide a valuable tool to assist surgeons for near real-time diagnosis. The tool is amenable to implementation as a tool for minimally invasive (laparoscopic) surgery. A modification of the current photoacoustic imaging system to include oxygen saturation mapping capability would provide yet more functional parameters, in order to facilitate intraoperative decision-making and reduce unnecessary surgical excisions when the risk of cancer in the examined ovary is extremely low.
Quantitative parameters are derived using Amira software. The parameters include three-dimensional vascular segment count, total volume and length, which are associated with tumor angiogenesis.
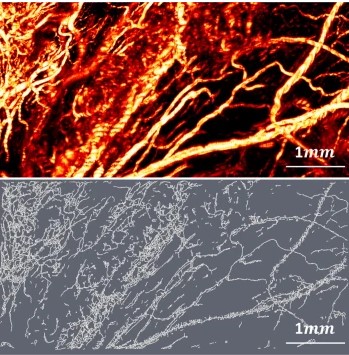
In post-processing mode, saved binary raw data are converted to B-scan images and analyzed quantitatively using a commercial 3D rendering and quantification software (Amira 6.0.1, Thermo Fisher Scientific, Waltham, MA)30. The post-processing flowchart is shown in Fig. 8. First, all OR-PAM B-Scan images generated from raw data acquired from the customized C++ program are loaded into Amira and the voxel setting in Amira is specified as 2.93 µm (x) by 8.56 µm (z) by 2.5 µm (y) volume. Then, a median filter with a window of 6 voxels is applied to enhance boundary definition and reduce background noise. Another non-local average filter is used to further reduce speckle noise. An auto-skeleton module is subsequently applied to divide the entire microvessel network in the image into many segments and find the centerlines of blood vessels. The module extracts the center line of filamentous structures from image data, which is segmented instantly with a user-defined threshold value. Specifically, it first calculates a distance map of the segmented image (Distance Map for Skeleton) based on the connectivity of signal intensity, and then performs a thinning of the label image using the Thinning module so that a final string of connected voxels remains (thinned), representing the centerline of the segment. The result is a 3-D graph view of a skeletonized object that can be visualized in the 3D viewer. Finally, a spatial graph statistics module is applied to extract quantitative features including number of segments, total volume, and total length from the 3-D data. The number of segments suggests how many branches exist within all blood vessels. The total volume and the total length reflect the size of the blood vessel networks. A projection image is generated from the 3-D graph view for visualization of the blood vessel network only and named as a spatial graph view. Note that all three features are normalized to the number of B-scans in each selected imaging area or volume. Student’s t-test is applied to these features to determine the statistical significance. Since the auto-skeleton module in Amira not only counts the number of vessels, but also the thickness and the degree of distortion of vessels, the malignant ovarian tissue microvascular network shows more normalized segments, normalized total volume, and normalized total length as compared to the well-organized and more uniform microvessel network of benign and normal ovarian tissue. Unlike the benign ovaries, a highly tortuous microvessel network with numerous branching small vessels is observed in fallopian tubes.
For Research Use Only. Not for use in diagnostic procedures.